Inspired by the excellent keynote by [@drob](https://twitter.com/drob) at rstudio::conf 2019, I’m resurrecting my long-dead blog.
Since I work mainly in R these days, I’ll be sharing useful code snippets, some #TidyTuesday exercises, and probably some other random thoughts along the way.
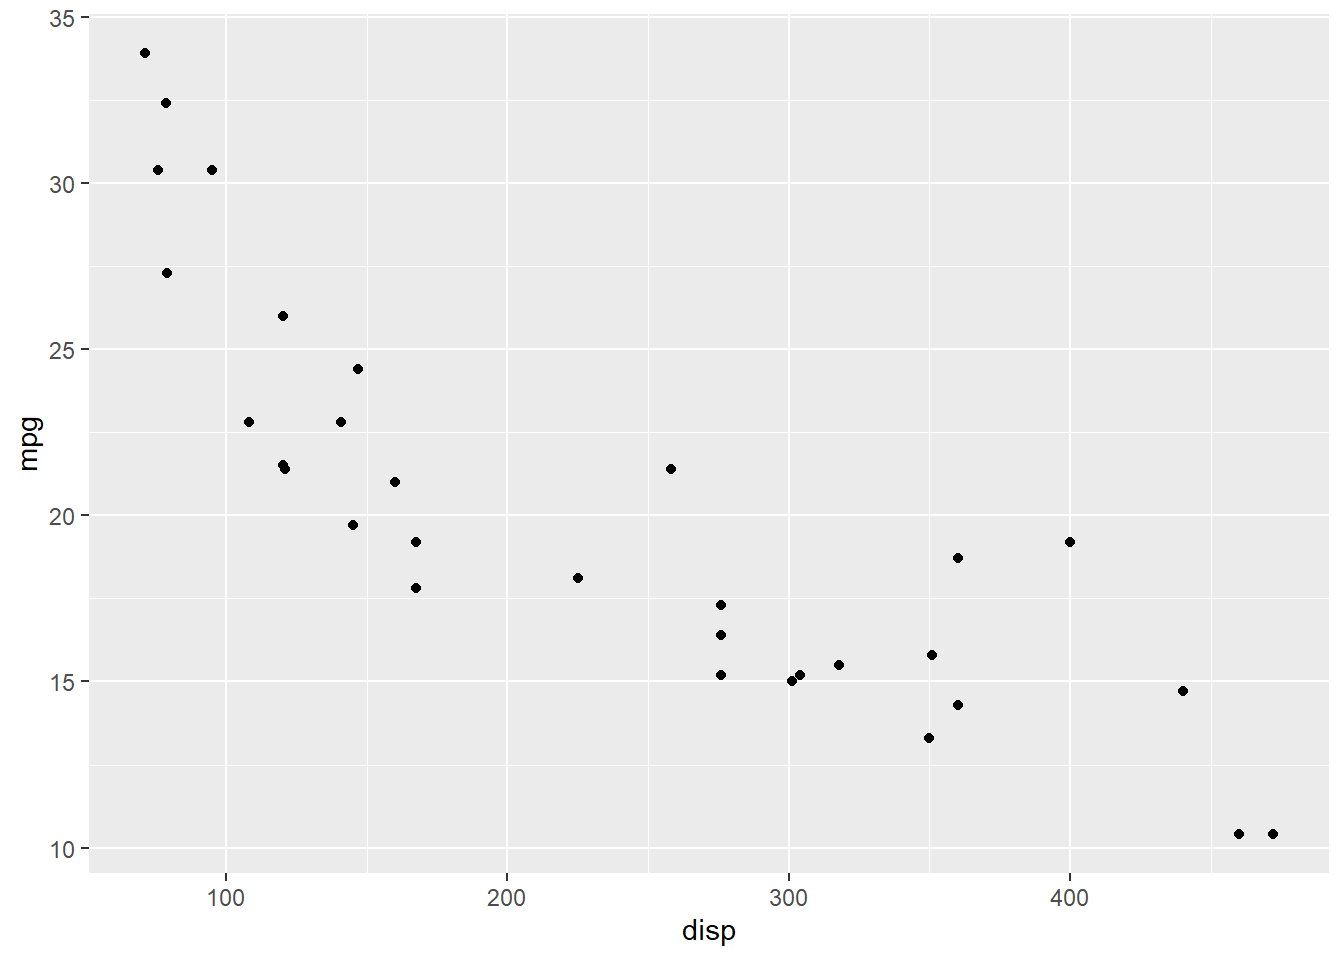
One thing I learned from rstudio::conf is that no R material is complete without an mtcars graph, so here you go:
library(ggplot2)
ggplot(mtcars, aes(x=disp, y=mpg)) + geom_point()